Architecture
Integrated Interactive Information Visualization Environment (IVE tool) is an interactive tool for visual analysis of data sets from usability tests. The tool allows the usability practitioner to analyze the data from the usability study performed in various types of test setups. From the analytical point of view, the IVE tool supports analysis of data sets from formative studies.
The IVE tool architecture is based on the structure of Information Visualization Reference Model, see figure bellow. This model represents framework suitable for implementation of various information visualization applications. Data sets recorded from from data sources during the usability test are connected with usability test context model in order to add test context information to the collected data. Visualizations use entire or part of usability test context model and particular data sets and visualize them through one or more views. Each view can be controlled by one or more controller components. Controller components can also edit the data sets, in order to add new observer notes or to synchronize the data sets. Usability problems, which may be connected to data sets and usability test context model, are created using controllers in the views.
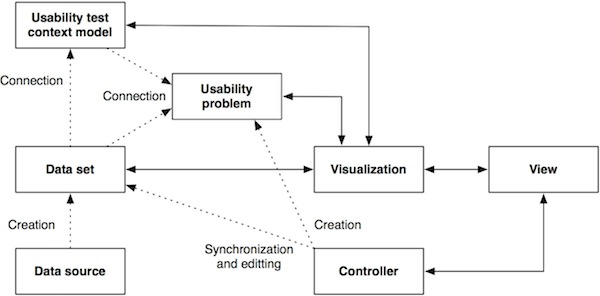
Figure: Information Visualization Reference Model taking into account usability test context model
In order to allow advanced analysis of the data sets, the data set records must be interpreted as records of context information in given time. When combined with models representing context of the usability test, these data sets can be analyzed in more advanced ways, e.g. in relation to user tasks, application state, location or user characteristics. Usability test context model is divided into five areas that cover main aspect of usability test – see figure bellow. These areas are Application, User, Environment, that are derived from software engineering context model and Test tasks and Observations that are derived from usability test requirements. Each area contains one or more models and these models may be interconnected with each other (e.g. task model with dialog model and task model with task list). Individual models are prepared before test execution step. Data sets recorded during any phase of the usability test, like user interaction logs or observer notes, are assigned to particular areas and models. Main goal of this segmentation of data sets is connection of individual records from data set with states in particular models that is available during analytical phase of the usability test. Special case is audio/video recording. This data set contains complex information about the test but can be interconnected with other data sets and models only through timestamps. Therefore it stays outside of any particular area.
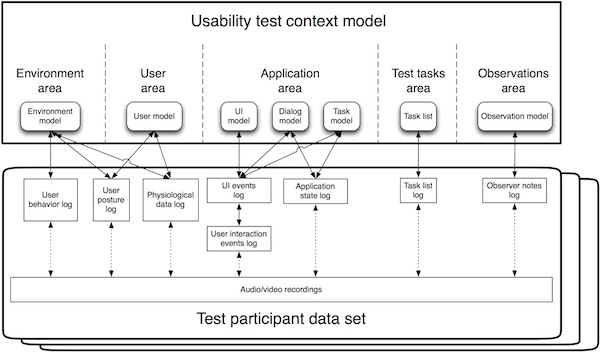
Figure: Overview of usability test context model.
IVE tool can support multiple formats of data sets and submodels of usability test context model. In figure bellow, there is shown how the process works. IVE uses an internal object database and convertor plug-ins to convert submodels of usability test context model into internal structure in object database. Convertor plug-ins are also used to convert data sets from raw sources into this internal database that basically contains records of key-value pairs (also called data tables in visualization rendering pipeline) or multimedia data. Convertor plug-ins are also responsible for interconnection of data sets and submodels of usability test context model.
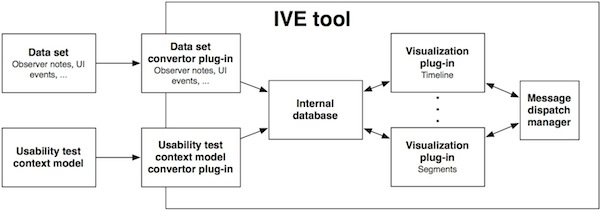
Figure: Schematic structure of the IVE tool and IVE convertor and visualization plug-ins
Each visualization is developed as a plug-in with one or more views. The visualizations have access to the IVE internal database and they can communicate with other visualization plug-ins through a simple message dispatching system. Depending on the structure of data sets available for particular usability test, the usability practitioner can use a subset of visualization plug-ins or a subset of the visualization plug-in functionality. That means no data source is mandatory, but when more data sources are available, the IVE tool is able to take advantage of this fact and can allow interconnection of data and therefore enhancement of visualizations.
The IVE tool was developed in Java on top of NetBeans Platform and therefore it includes several features typical for this platform. First of all, it is the usage of the built-in plug-in update manager, which is used for all plug-ins for the IVE tool and which allows unified handling of plug-ins. Second, the tool uses a window management of the NetBeans platform that allows a complex placement and manipulation or even undocking of the visualization plug-in views in the main panel of the tool. IVE tool with visualization plug-in views developed for analysis of data from NaviTerier navigation application is shown in Figure bellow.

Figure: IVE tool with Timeline visualization plug-in (A), two Video viewer plug- ins (B, C) Segment viewer plug-in (D), HRV viewer plug-in (E), and Detail window (F).